Need help? Should you have any issues with this setup, please email support@cerelog.com.
Having Connection Issues? Start Here
If you are having trouble getting the board to connect or stream data, check our dedicated troubleshooting repository for common fixes and debug steps:
View Troubleshooting & Debug GuideCerelog BCI/EEG Board User Guide
Welcome! This guide contains everything you need to set up, configure, and use your Cerelog 8-channel Brain Computer Interface board.
Table of Contents
- 1. Critical Safety & Legal Notices
- 2. Prerequisites: What You'll Need
- 3. Hardware Overview
- 4. Software Setup & First Data Stream
- 5. Running an EEG Session
- 6. Advanced Usage: Firmware Customization
- 7. Troubleshooting Guide
- 8. Product Demonstrations
- 9. Applications & Possibilities
- 10. Appendix: Pinout & Technical Details
1. Critical Safety & Legal Notices
⚠️ ELECTRICAL SHOCK HAZARD - READ IMMEDIATELY
This product does not have medical-grade isolation circuitry and is not protected from mains faults or power surges. To prevent risk of serious injury or death from electrical shock, you MUST adhere to the following rules:
- NEVER use this device on a human subject while it is connected to a desktop computer plugged into a wall outlet.
- NEVER use this device on a human subject with a laptop computer that is actively charging from a wall outlet.
- ALWAYS operate this device for human data collection using a laptop running on its own battery power, or by connecting the board to an appropriate LIPO battery for power.
Evaluation Board/Kit Important Notice
Cerelog, Inc. provides the enclosed product(s) under the following conditions: This evaluation board/kit is intended for use for ENGINEERING DEVELOPMENT, DEMONSTRATION, OR EVALUATION PURPOSES ONLY and is not considered by Cerelog, Inc. to be a finished end-product fit for general consumer use.
Persons handling the product(s) must have electronics training and observe good engineering practice standards. As such, the goods being provided are not intended to be complete in terms of required design-, marketing-, and/or manufacturing-related protective considerations, including product safety and environmental measures typically found in end products that incorporate such semiconductor components or circuit boards.
This evaluation board/kit does not fall within the scope of the European Union directives regarding electromagnetic compatibility, restricted substances (RoHS), recycling (WEEE), FCC, CE or UL, and therefore may not meet the technical requirements of these directives or other related directives.
2. Prerequisites: What You'll Need
Hardware & Accessories (Not Included)
The following links point to recommended third-party vendors. Cerelog Inc. is not affiliated with these vendors and assumes no liability for their products.
- Power Source: A 3.7V LIPO battery is recommended for portable, untethered use. (Qty: 1, Recommended)
- Data Cable: A high-quality USB-C cable rated for data transfer. (Qty: 1)
- EEG Electrode Cap: A professional cap for placing electrodes on the scalp. (Qty: 1)
- Electrode Gel/Paste: Conductive gel for a low-impedance connection. (Qty: 1)
-
Touch-Proof Adapters:
Essential for connecting the electrode cap to the board. (Qty: 1)
IMPORTANT: Adapter & Montage
- The board's default firmware is configured for Referential Montage.
- This setup uses pins 1-8 (+) as the input electrodes and SRB1 as the common reference/ground.
- This configuration typically requires only ONE (1) touch-proof adapter to operate.
DIY Headset Alternatives Don't have money to buy an entire headset? Make your own...
Ultracortex Mark III — 3D-Printed Rigid Cap Third-party 3D-printed EEG cap with Cerelog adapter plate
As a cost-effective alternative, you can build your own data acquisition cap by using the 3D print files for the Ultracortex Mark III headset, a third-party project.
To make this headset compatible with the Cerelog ESP-EEG PCB, you must also print our special adapter plate (using the .stl file) and secure it to the headset with bolts or zip ties.
View Cerelog Adapter Plate FilesThe springs for the headset can be hard to find at a good price. For the soft main springs, we have found that 12mm OD, 0.6mm Wire Size, 20mm Free Length, Silver Tone springs (Size: 12x0.6x20mm) from Amazon work well.
View Recommended SpringsPlease note: We are not affiliated with the third-party vendors who provide the Ultracortex files or the recommended springs.
CereBRAH Soft-EEG — Community-Built Soft Headband A low-cost, DIY soft EEG headband made from nylon webbing and elastic
A community contributor designed the CereBRAH Soft-EEG — a wearable EEG headband that holds dry electrodes at standard 10-20 positions. Unlike rigid caps, it's built from 50 mm elastic band and hook-and-loop nylon webbing joined by staples, so it flexes to fit the head, packs flat, and is cheap to build and repair.
Work in progress: This project is still under active development. Designs, cut lengths, parts, and instructions may change.
View CereBRAH Soft-EEG Project DetailsCommunity project — not tested or verified by Cerelog. Not a medical device.
Software & Development Tools
- A code editor, like VS Code.
- Python (version 3.7 or newer).
- Git for cloning software repositories.
- For BrainFlow use:
- Microsoft C++ Build Tools (on Windows) or equivalent build essentials on Mac/Linux.
- CMake.
3. Hardware Overview
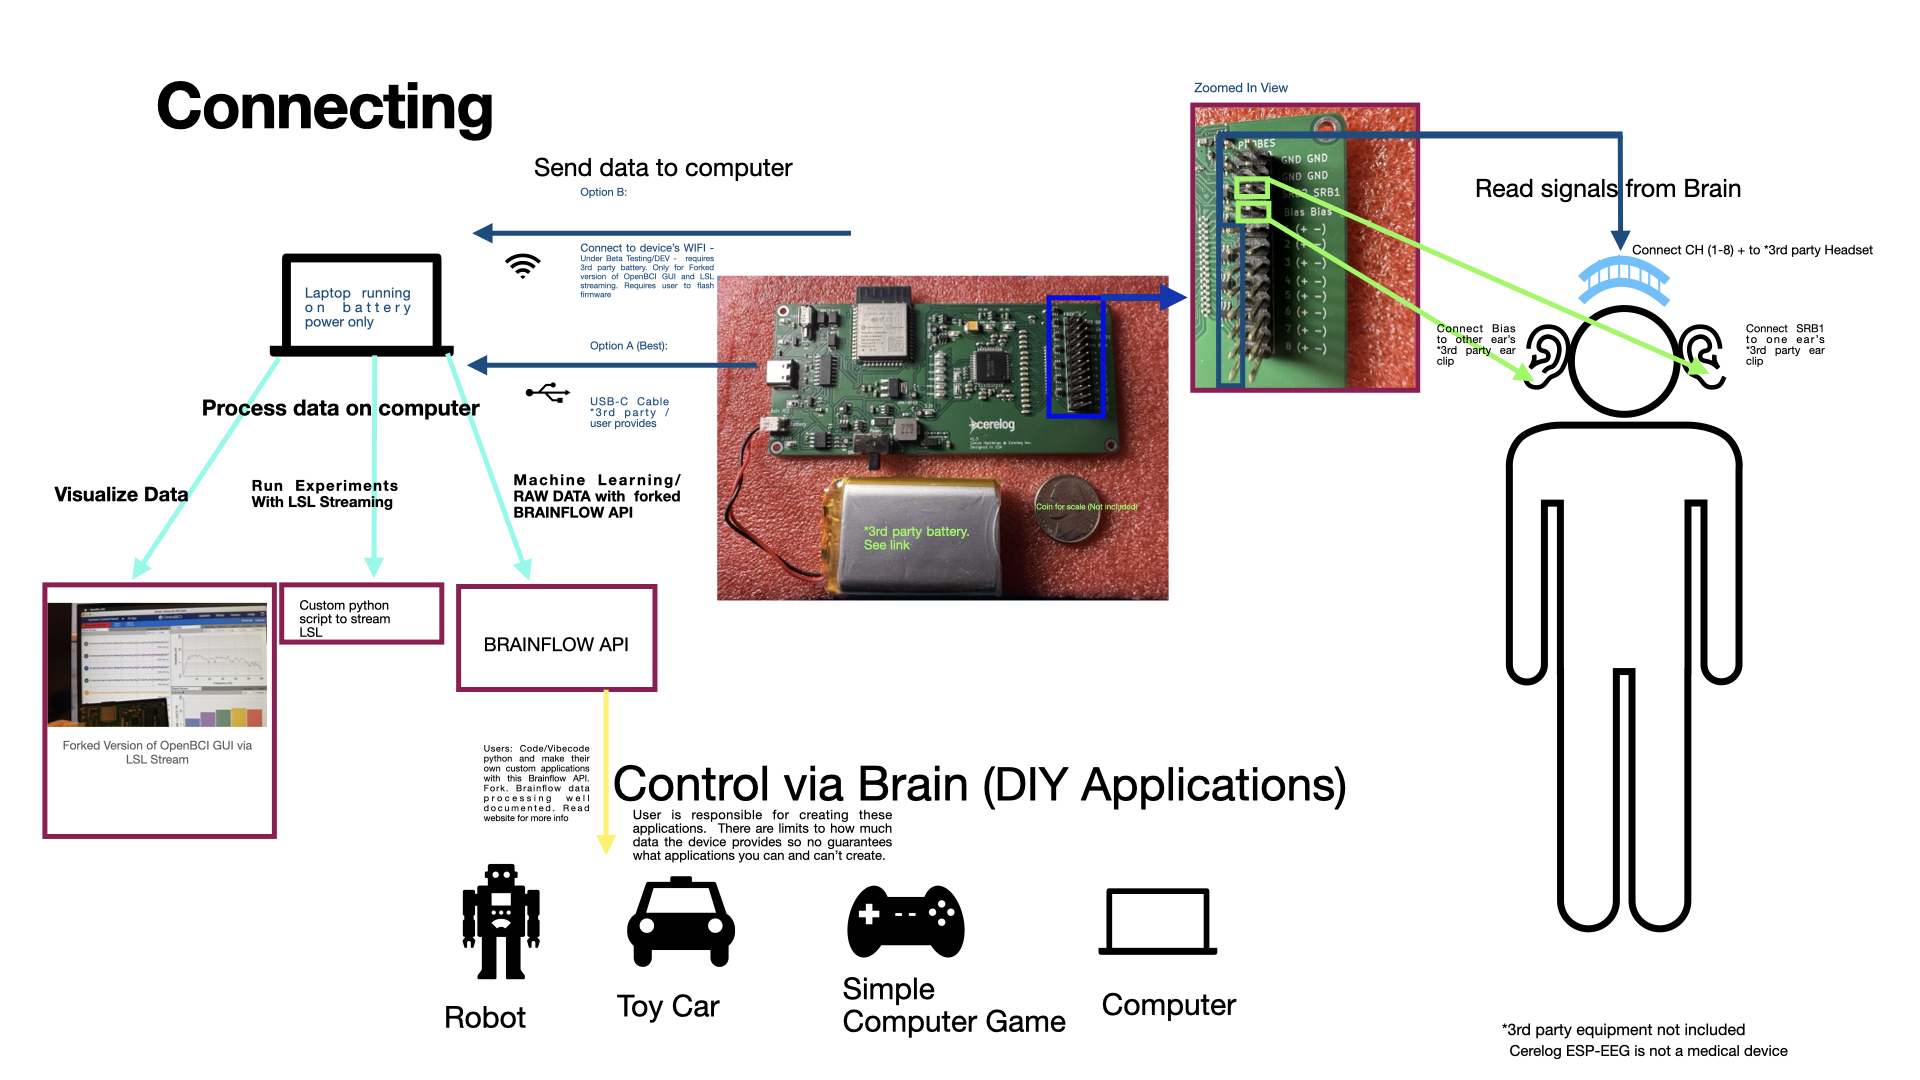
Connecting the PCB for Data Collection
EEG Setup (Scalp Recording)
- SRB1 pin — This is the negative (–) reference electrode for all 8 channels. Attach an earclip electrode to one ear. Apply conductive gel under the earclip for a good connection.
- BIAS pin — Attach a second earclip electrode to the other ear, also with conductive gel.
- CH1+ through CH8+ — Connect these to your headset electrodes of choice. These are the only channel pins you need for a standard EEG setup.
- CH1– through CH8– — Leave these unconnected. In the default firmware configuration these pins are not tied to SRB1 and are not used. Only connect them if you change the montage by editing and reflashing the firmware.
Tip: If you run into signal quality issues, give the GND pin a try in place of the BIAS pin on the second earclip — it may help.
EMG Setup (Muscle Recording)
To record one channel of EMG data (e.g. forearm muscles):
- CH1+ — Place on the top of the forearm (over the muscle belly).
- SRB1 — Place on the bottom of the forearm as the negative (–) reference.
- GND pin — Place on the elbow. For EMG, the GND pin works best as the ground reference rather than the BIAS pin.
Tip: If you experience signal issues during any recording, try swapping the BIAS pin connection for the GND pin — it can often provide better performance when signal collection problems arise.
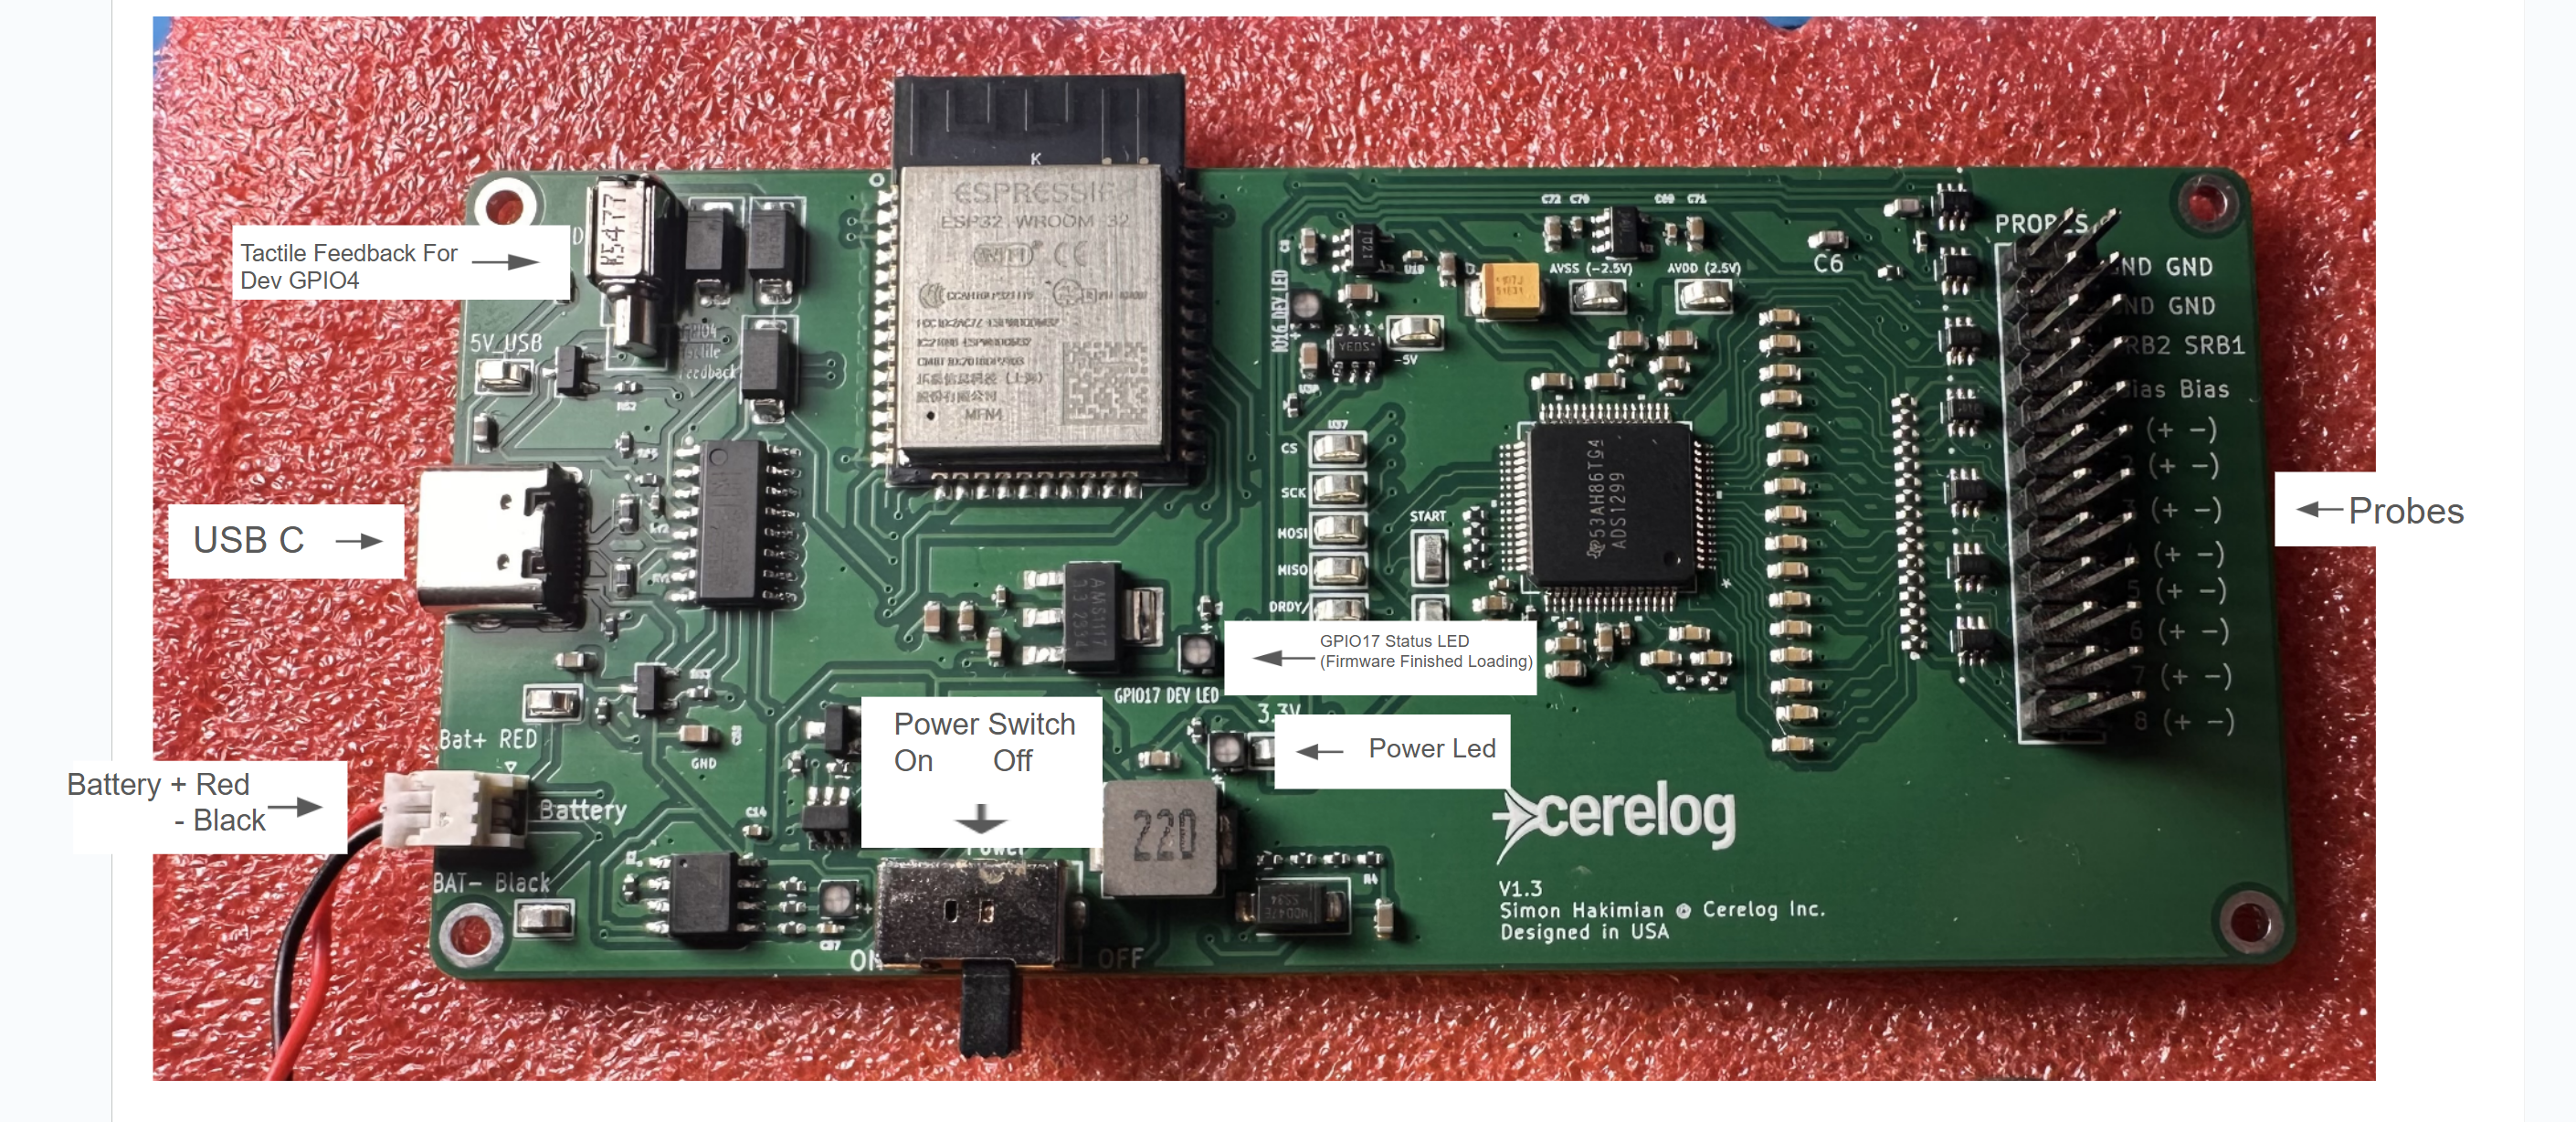
- USB-C Port: For data streaming, powering the board, and charging a connected LIPO battery.
- JST-PH Battery Connector: 2.0mm pitch connector for an optional 3.7V LIPO battery.
- Electrode Header Pins: Two 10-pin headers for connecting the touch-proof adapters. The SRB1 pin on the ADC is used for referential montage mode (default).
- Power LED (Green): Located below the Status LED, this indicates the board is receiving power from USB or a battery.
- GPIO17 Status LED (Green): This LED indicates the firmware status:
- SOLID ON: Firmware has finished loading, and the board is ready to connect and stream data.
- OFF: Board is not powered, or firmware has not loaded.
- Battery Charge Status LED: Located to the left of the power switch (not labeled on the diagram). This LED indicates the charging status of a connected LIPO battery: RED when charging, and GREEN when fully charged.
- Onboard Motor: A tactile feedback motor that can be controlled via custom firmware. Note that activating it will introduce noise into EEG signals.
Connecting the Battery Correctly
Carefully align the JST plug so the RED wire connects to the 'RED' (+) marking on the PCB and the BLACK wire connects to the 'BLK' (-) marking. To remove the connector, do not pull the wires; gently squeeze the plastic plug and wiggle it out of the socket.
4. Software Setup & First Data Stream
This section guides you through installing software to visualize your EEG data.
A Note for Beginners
The following steps require using your computer's Terminal (also called a command prompt or shell). This is a text-based way to interact with your computer. We recommend using a modern code editor like VS Code, which has a built-in terminal and makes it easy to view files.
Basic Terminal Commands
ls: Lists the files and folders in your current location.cd FOLDER_NAME: Changes directory into the specified folder.cd ..: Moves up one level to the parent folder.
Important Notes
- Before running any commands to clone a repository, first use
cdto navigate to a folder you can easily find, like your Desktop or Documents folder. - On macOS, Python and its package manager `pip` are often installed as `python3` and `pip3` to distinguish them from an older, system-installed version of Python. In this guide, whenever you see
pythonorpip, usepython3andpip3if you are on a Mac. - To stop a script that is running in the terminal, press
Ctrl + C(on Windows/Linux) orCmd + C(on Mac).
Note: Device refuses to connect? Read this helpful troubleshooting guide.
Step 1 (Optional): Install Drivers if Needed
Modern operating systems like Windows 10/11 and recent versions of macOS/Linux should recognize the board automatically. Only follow this step if your computer fails to detect the board or assign it a COM port.
Install CH340C USB-to-Serial Drivers (V1.3 only)
If needed, install the CH340C chipset driver. Follow the SparkFun guide linked below for step-by-step instructions for your operating system.
CH340 Driver Installation Guide (SparkFun)Also: Linux Users May Need the CH341SER Driver
If the CH340C driver above still doesn't work, try the CH341SER driver instead (this is a separate driver from the CH340C linked above). This usually works better for Linux and can often fix issues with the board not connecting.
Download CH341SER DriverNote: If you decide to use the CH341SER driver, you may need to hardcode the port names in your BrainFlow test scripts and LSL linking script. Read here for instructions on hardcoding port names.
Debug Step: Hardcoding Port Names
Some computers assign unusual or unexpected port names to the device. If automatic detection fails, you will need to hardcode the exact port name into your test script.
Read the manual port connection guide here.
For additional debug help, see the full Troubleshooting & Debug Guide.
Step 2: Choose and Configure Your Visualization Method
Method A: Using the BrainFlow Library
(Recommended / Advanced) This involves building our custom fork of the BrainFlow library from source. This compilation is a one-time setup for your computer. Because the core library is written in C++, it must be compiled specifically for your operating system (Windows, Mac, or Linux). You only need to repeat the build process (Step A.2) if you modify the underlying C++ source code files (.cpp, .h). Creating new Python scripts does not require a rebuild.
-
A.1: Get the Custom BrainFlow Fork
Our board requires a specific fork of BrainFlow. Clone it and navigate into the new directory:
Important: Use This Specific Repository
This version of BrainFlow contains code specific to the Cerelog board. This code has not yet been merged into the official, main BrainFlow repository. You must use the link provided below.
git clone https://github.com/shakimiansky/Shared_brainflow-cerelog.gitcd Shared_brainflow-cerelog -
A.2: Build the Library from Source
This crucial step compiles the C++ core of the library. If you make a mistake, manually delete the `build` folder and start this step over.
macOS Users: Install Build Tools First
Before proceeding, you need to install Homebrew (a package manager) and CMake. Open a terminal and run the following commands one by one:
/bin/bash -c "$(curl -fsSL https://raw.githubusercontent.com/Homebrew/install/HEAD/install.sh)"brew install cmakeCompilation Steps:
First, create a new directory named `build` inside the `Shared_brainflow-cerelog` folder and navigate into it.
mkdir buildcd buildNext, run the correct `cmake` command for your operating system to prepare the build files.
For Windows (with Visual Studio 2022):
cmake .. -G "Visual Studio 17 2022" -A x64For macOS / Linux:
cmake ..Finally, run the build command. This uses 4 processor cores (`-j4`) for faster compilation; you can adjust this number.
cmake --build . --config Release --clean-first -j4 -
A.3: Install the Python Package
With the core library built, navigate from the `build` folder back up and into the Python wrapper folder.
cd ..cd python_packageInstall the package in "editable" mode. (Remember to use
pip3on Mac). This links the package to the source files, so you don't need to reinstall after making changes. This command only needs to be run once to set up your environment.pip install -e . -
A.4: Install Required Python Libraries
Before running any scripts, install the required Python libraries. Run the command below. (Use
pip3on Mac).pip install matplotlib pyserial plotly dash scikit-learn "setuptools<82"If the command above fails, install them one at a time:
pip install matplotlibpip install pyserialpip install plotlypip install dashpip install scikit-learnpip install "setuptools<82" -
A.5: Helpful Videos if You Get Stuck
🎬 2 Quick Videos Using Cerelog ESP-EEG with Brainflow
These are supplemental only. Use them if you get visually stuck — but the written guide above is far more detailed and covers setup steps and command scripts that the videos do not include. Always follow the written steps; treat these videos as a secondary visual reference only.ESP-EEG with Brainflow
General Product Usage Overview
⚠️ These videos do not cover all setup command scripts. Always refer to the written guide above for the complete setup procedure.
👇 Keep scrolling! The setup guide continues below — this section is not finished yet. - Import Libraries: You always need BoardShim and BrainFlowInputParams. For this example, we also import BoardIds to select our board, time for pausing, and numpy and matplotlib for data handling and plotting.
-
Initialize and Configure:
params = BrainFlowInputParams()creates a configuration object. For the Cerelog board over USB, you don't need to set any special parameters.board_id = BoardIds.CERELOG_X8_BOARDselects the specific board you're using from a list of supported devices.board = BoardShim(board_id, params)creates the main board object that you'll use to control everything.
-
Get Board Info: Before connecting, you can get the board's specifications (like its sampling rate and which rows in the data array will contain EEG data) using static methods like
BoardShim.get_eeg_channels(board_id). This is the best practice and makes your code more readable. -
Connect and Stream Data:
board.prepare_session()finds the board and opens the connection.board.start_stream()tells the board to start collecting data into an internal buffer.time.sleep(...)pauses your script to let data collect in the buffer.board.stop_stream()stops the collection.
-
Retrieve and Index Data:
data = board.get_board_data()retrieves all the data from the buffer as a 2D NumPy array.- The `data` array has a specific structure. Each row represents a different channel. By using the channel arrays you fetched in step 3, you can easily select the correct rows:
eeg_data = data[eeg_channels]for the EEG data, andtime_data = data[timestamp_channel]for the timestamps. - For advanced users: If you wish to hardcode the indices, the data array for the Cerelog board is typically organized as follows, though using the `get...` methods is strongly recommended:
- Row 0: Packet Counter
- Rows 1-8: EEG Channels
- Row 9: Marker Channel
- Row 10: Timestamp Channel
-
Clean Up: Always call
board.release_session()in a `finally` block. This ensures the connection to the board is closed properly, freeing up the COM port for other applications. -
1. Detrend: Removes the DC offset (the constant voltage drift) so the signal centers around 0 microvolts.
DataFilter.detrend(eeg_plot_data[i], DetrendOperations.CONSTANT.value)
-
2. Low-Pass (100Hz): Removes high-frequency noise that isn't EEG. We use a 4th-order Butterworth filter for stability in real-time streams.
DataFilter.perform_lowpass(eeg_plot_data[i], sampling_rate, 100.0, 4, FilterTypes.BUTTERWORTH, 0)
-
3. Band-Stop (Notch Filters): Specifically targets 50Hz and 60Hz noise caused by electrical mains (wall outlets).
DataFilter.perform_bandstop(eeg_plot_data[i], sampling_rate, 48, 52, 3, FilterTypes.BUTTERWORTH, 0)
DataFilter.perform_bandstop(eeg_plot_data[i], sampling_rate, 58, 62, 3, FilterTypes.BUTTERWORTH, 0) -
4. High-Pass (0.5Hz): Removes extremely slow drifts caused by movement or sweat.
DataFilter.perform_highpass(eeg_plot_data[i], sampling_rate, 0.5, 4, FilterTypes.BUTTERWORTH, 0)
-
5. Rolling Median: A final smoothing pass that helps remove sudden spikes without blurring the signal as much as a mean filter would.
DataFilter.perform_rolling_filter(eeg_plot_data[i], 3, AggOperations.MEDIAN.value)
-
A.6: Run Included Tests
Wait for the Green LED!
Before running any test that connects to the board, make sure you've plugged it in and waited for the green GPIO17 status LED to turn solid on. This indicates the firmware has loaded and the board is ready to stream.
The repository includes a comprehensive test suite. To run them, you must be inside the
python_packagedirectory.1. Recommended First Test: Visual Data Stream
We strongly recommend running the Filtered Plot test first. This script provides a real-time, filtered graph of all 8 channels, allowing you to instantly verify signal quality and electrode contact.
cd cerelog_testspython filtered_plot.pyDid you get:
ModuleNotFoundError: No module named 'pkg_resources'?This is because your version of setuptools has removed this legacy module. To fix it, downgrade setuptools by running:
python3 -m pip install "setuptools<82"On Windows, use
pythoninstead ofpython3:python -m pip install "setuptools<82"Note: Device refuses to connect? Read this helpful troubleshooting guide.
2. Run PCB Health Check Suite
To verify the technical integrity of the board (timestamps, packet loss, serial connection), run the automated test suite.
python run_all_tests.pyKey Tests Explained
test_brainflow.py- The best starting point for developers. It demonstrates the full cycle: connecting to the board, streaming data, and calculating basic stats. It also saves the raw data to a CSV file.
unix_plot.py- Highly recommended test. This script connects to the board, streams data, and provides a real-time plot, making use of the board's Unix timestamps for accurate timing.
test_serial.py- A low-level test that bypasses BrainFlow to communicate directly with the board. Use this if you suspect a fundamental serial connection or packet format issue.
test_unix_timestamps.py- An advanced test for verifying time synchronization between the board and your PC, crucial for time-sensitive experiments.
For a complete list of tests and advanced debugging options, please see the `README.md` file inside the `cerelog_tests` directory. -
A.7: Play BCI Pong (New)
⚠️ EPILEPSY & LIABILITY WARNING
Games contained in this software repository may contain flickering lights or flashing patterns which can trigger seizures in individuals with photosensitive epilepsy. By choosing to run these games, you acknowledge these risks. You agree to hold Cerelog Inc. and all affiliated parties harmless from any liability or damages that may arise from their use.
Once you have installed the BrainFlow library (Steps A.1 through A.3), you can play the new BrainFlow-enabled Pong game.
Performance Requirement
This game uses SSVEP (Steady-State Visually Evoked Potential) which relies on high-frequency flickering lights. It will not work properly on slow computers because the screen cannot refresh fast enough to create the required brain stimulation frequencies.
To play, navigate to the games folder inside the Python package:
cd Games/"Fancy JS Game"Run the game script (remember to use
python3on Mac):python pong_game_brainflow.pyNote: You may find other games in the Games directory that are currently under development.
Click to Expand: Learning How to Write and Filter BrainFlow Data
Once you have BrainFlow installed, you can write your own Python scripts to control the board and acquire data. This section provides a complete learning path, starting from a basic script and moving to advanced real-time filtering.
Part 1: Understanding Data Scaling & Basic Scripting
To write your own applications, we recommend studying the example script below in combination with the unix_plot.py test script found in the repository. For in-depth information on functions, consult the official BrainFlow documentation.
1. Basic Example: Stream & Static Plot
Save the code below as a new file, for example my_plot_test.py, inside the test folder you used previously: Shared_brainflow-cerelog/python_package/cerelog_tests. Then run it from the terminal.
import time
import numpy as np
import matplotlib.pyplot as plt

from brainflow.board_shim import BoardShim, BrainFlowInputParams, BoardIds, BrainFlowError

def main():
    """
    A simple script to connect to a BCI, collect data for a few seconds,
    and then plot the EEG data.
    """
    # Board and acquisition parameters
    board_id = BoardIds.CERELOG_X8_BOARD
    duration_seconds = 10

    # --- 1. SETUP THE BOARD ---
    # BrainFlow uses a params object to configure the board
    params = BrainFlowInputParams()

    # Create the BoardShim object
    board = BoardShim(board_id, params)

    # Use a try/finally block to ensure session is always released
    try:
        # Get board info using static methods
        eeg_channels = BoardShim.get_eeg_channels(board_id)
        timestamp_channel = BoardShim.get_timestamp_channel(board_id)
        sampling_rate = BoardShim.get_sampling_rate(board_id)

        print(f"Connecting to {board.get_board_descr(board_id)['name']}...")
        print(f"EEG Channels: {eeg_channels}")
        print(f"Sampling Rate: {sampling_rate} Hz")

        # Prepare the session (finds the board and establishes connection)
        board.prepare_session()

        # --- 2. ACQUIRE DATA ---
        print(f"\nStarting stream for {duration_seconds} seconds...")
        board.start_stream()
        time.sleep(duration_seconds)

        # Stop the stream and get the data from the internal buffer
        board.stop_stream()
        print("Stream stopped. Getting data...")
        data = board.get_board_data()

        if data.size == 0:
            print("Error: No data was collected.")
            return

        # --- 3. PROCESS AND PLOT DATA ---
        # Get the specific data streams from the data array
        eeg_data = data[eeg_channels]
        timestamps = data[timestamp_channel]

        # Create a time axis starting from 0
        time_axis = timestamps - timestamps[0]

        print("Plotting data...")
        plt.figure(figsize=(15, 8))

        # Plot each EEG channel with a vertical offset for clarity
        offset_value = 150 # µV
        for i, channel_data in enumerate(eeg_data):
            plt.plot(time_axis, channel_data + i * offset_value, label=f'Channel {eeg_channels[i]}')

        # Add titles and labels for clarity
        plt.title(f'{duration_seconds} Seconds of Cerelog EEG Data')
        plt.xlabel('Time (s)')
        plt.ylabel('Voltage (µV) - Channels are offset for clarity')
        plt.legend(loc='upper right')
        plt.grid(True)
        plt.tight_layout()

        # Show the plot
        plt.show()

    except BrainFlowError as e:
        print(f"BrainFlow Error: {e}")
    except Exception as e:
        print(f"An unexpected error occurred: {e}")
    finally:
        # --- 4. CLEAN UP ---
        # Always release the session to free the COM port
        if board.is_prepared():
            print("\nReleasing session.")
            board.release_session()

if __name__ == "__main__":
    main()
How It Works: A High-Level Overview
All BrainFlow Python scripts follow a similar pattern:
⚠️ IMPORTANT: Scaling Cerelog Data in BrainFlow
Unlike some other devices, the Cerelog board provides raw, unscaled voltage data to give you maximum fidelity and control. When processing this data in your own BrainFlow scripts, you must apply a scaling factor to convert the raw voltage values into standard units.
Failure to apply the voltage conversion will result in incorrect plots and analysis, with a flat-looking vertical (voltage) scale.
Required Data Conversions:
Inside your data processing loop or after you retrieve data with board.get_board_data(), apply the following:
# Get the raw data streams from the main data array
eeg_data_raw = data[eeg_channels]
timestamps_raw = data[timestamp_channel]

# --- 1. Scale EEG Data (Vertical Axis) ---
# The board returns data in Volts (V). To get microvolts (µV),
# the standard unit for EEG, you must multiply by 1,000,000.
eeg_data_microvolts = eeg_data_raw * 1e6

# --- 2. Timestamp Data (Horizontal Axis) ---
# The board sends timestamp data in milliseconds, but BrainFlow
# automatically converts it to Unix time in seconds. No additional
# scaling is needed. Simply make it relative to the start time.
time_axis_seconds = timestamps_raw - timestamps_raw[0]
Always use the scaled variable eeg_data_microvolts for your plotting and analysis functions. The timestamp data does not need to be scaled — BrainFlow handles the conversion to seconds automatically.
Part 2: Advanced Real-Time Filtering
Reaching clean EEG data requires more than just connecting to the board. You must apply digital signal processing (DSP) to remove noise and isolate the brainwaves. While the basic test above shows you how to stream, we recommend using the script below (filtered_plot.py) as your main reference for creating robust applications.
Understanding the Filters
The code below implements a chain of filters crucial for real-time BCI. Here is what they do:
2. Advanced Example: Real-Time Filtering & Scrolling
Save the code below as filtered_plot.py and run it.
import time
import numpy as np
import matplotlib.pyplot as plt
from matplotlib.animation import FuncAnimation
from brainflow.board_shim import BoardShim, BrainFlowInputParams, BoardIds, BrainFlowError
from brainflow.data_filter import DataFilter, FilterTypes
from brainflow.data_filter import NoiseTypes, DetrendOperations, AggOperations, WaveletTypes, NoiseEstimationLevelTypes, WaveletExtensionTypes, ThresholdTypes, WaveletDenoisingTypes
# --- Configuration ---
BOARD_ID = BoardIds.CERELOG_X8_BOARD
SECONDS_TO_DISPLAY = 10
UPDATE_INTERVAL_MS = 40
Y_AXIS_PADDING_FACTOR = 1.2

# --- Global variables ---
board = None
eeg_channels = []
sampling_rate = 0
window_size = 0
data_buffer = np.array([])
y_limits = {}

def main():
    """
    Connects to the Cerelog board and creates a robust, real-time, scrolling plot
    with stable filtering and adaptive scaling.
    """
    global board, eeg_channels, sampling_rate, window_size, data_buffer, y_limits

    params = BrainFlowInputParams()
    params.timeout = 15
    board = BoardShim(BOARD_ID, params)

    try:
        eeg_channels = BoardShim.get_eeg_channels(BOARD_ID)
        sampling_rate = BoardShim.get_sampling_rate(BOARD_ID)
        window_size = SECONDS_TO_DISPLAY * sampling_rate

        if sampling_rate <= 0:
            raise BrainFlowError("Could not get a valid sampling rate from the board.", 0)

        for i in range(len(eeg_channels)):
            y_limits[i] = (-100, 100)

        print(f"Connecting to {board.get_board_descr(BOARD_ID)['name']}...")
        print(f"Detected Sampling Rate: {sampling_rate} Hz")
        board.prepare_session()
        print("\nStarting stream... Close the plot window to stop.")
        board.start_stream(5 * 60 * sampling_rate)
        time.sleep(2)

        num_board_channels = BoardShim.get_num_rows(BOARD_ID)
        data_buffer = np.empty((num_board_channels, 0))

        # --- Plot Setup ---
        fig, axes = plt.subplots(4, 2, figsize=(18, 10), sharex=True)
        fig.suptitle('Real-Time Cerelog EEG Waveforms (Correct Time Spacing)', fontsize=16)
        axes_flat = axes.flatten()
        lines = [ax.plot([], [], lw=1)[0] for ax in axes_flat]

        for i, ax in enumerate(axes_flat):
            ax.set_title(f'Channel {eeg_channels[i]}')
            ax.set_ylabel('Voltage (µV)')
            ax.grid(True)
            ax.set_xlim(-SECONDS_TO_DISPLAY, 0)

        fig.text(0.5, 0.04, 'Time (Seconds from "Now")', ha='center', va='center')
        plt.tight_layout(rect=[0, 0.05, 1, 0.96])

        def on_close(event):
            print("Plot window closed, stopping stream...")
            if board and board.is_prepared():
                board.stop_stream()
                board.release_session()
            print("Session released. Exiting.")

        fig.canvas.mpl_connect('close_event', on_close)

        ani = FuncAnimation(fig, update_plot, fargs=(lines, axes_flat), interval=UPDATE_INTERVAL_MS, blit=False)
        plt.show()

    except Exception as e:
        print(f"An error occurred in main(): {e}")
    finally:
        if board and board.is_prepared():
            board.release_session()

def update_plot(frame, lines, axes):
    """
    This function is called periodically to update the plot data.
    """
    global data_buffer, y_limits

    try:
        new_data = board.get_board_data()
        if new_data.shape[1] > 0:
            data_buffer = np.hstack((data_buffer, new_data))
            buffer_limit = int(window_size * 1.5)
            if data_buffer.shape[1] > buffer_limit:
                data_buffer = data_buffer[:, -buffer_limit:]

        plot_data = data_buffer[:, -window_size:]

        num_points = plot_data.shape[1]
        if num_points < 2:
            return

        eeg_plot_data = plot_data[eeg_channels] * 1e6

        # --- Filtering Logic (Corrected for Real-Time Stability) ---
        for i in range(len(eeg_channels)):
            # Use a safe data length check for the filters
            if eeg_plot_data[i].size > 20:
                #1 Detrend to get dc offset away
                DataFilter.detrend(eeg_plot_data[i], DetrendOperations.CONSTANT.value)
                # 2. Apply a STABLE 4nd-order low-pass 100hz. This is crucial for real-time processing.
                DataFilter.perform_lowpass(eeg_plot_data[i], sampling_rate, 100.0, 4, FilterTypes.BUTTERWORTH, 0)

                # 3. Apply the band-stop (notch) filter for 50, 60 Hz noise.
                DataFilter.perform_bandstop(eeg_plot_data[i], sampling_rate, 48, 52, 3, FilterTypes.BUTTERWORTH, 0)
                DataFilter.perform_bandstop(eeg_plot_data[i], sampling_rate, 58, 62, 3, FilterTypes.BUTTERWORTH, 0)

                #4 High Pass above 0.5 Hz
                DataFilter.perform_highpass(eeg_plot_data[i], sampling_rate, 0.5, 4, FilterTypes.BUTTERWORTH, 0)

                #5. More cleaning data up
                #DataFilter.perform_rolling_filter(eeg_plot_data[i], 3, AggOperations.MEAN.value)
                DataFilter.perform_rolling_filter(eeg_plot_data[i], 3, AggOperations.MEDIAN.value)
                # (This is redundant notch) DataFilter.remove_environmental_noise(eeg_plot_data[i], sampling_rate, NoiseTypes.FIFTY_AND_SIXTY.value)
                #DataFilter.perform_wavelet_denoising(eeg_plot_data[i], WaveletTypes.BIOR3_9, 3,
                                                # WaveletDenoisingTypes.SURESHRINK, ThresholdTypes.HARD,
                                                # WaveletExtensionTypes.SYMMETRIC, NoiseEstimationLevelTypes.FIRST_LEVEL)

        # --- Manual Time Axis Generation (for True Scrolling) ---
        time_vector_full_window = np.linspace(-SECONDS_TO_DISPLAY, 0, window_size)
        time_vector_for_plot = time_vector_full_window[-num_points:]

        for i, (line, ax) in enumerate(zip(lines, axes)):
            channel_data = eeg_plot_data[i]

            # Check for invalid filter output (NaN) to prevent crashes
            if np.isnan(channel_data).any():
                print(f"Warning: NaN detected in channel {eeg_channels[i]} after filtering. Skipping one update.")
                continue

            centered_data = channel_data - np.mean(channel_data)

            line.set_data(time_vector_for_plot, centered_data)

            # --- Adaptive Y-Axis Logic ---
            # Define how many recent samples to use for auto-scaling (last 4 seconds)
            samples_for_scaling = int(4.0 * sampling_rate)
            recent_data = centered_data[-samples_for_scaling:]

            if recent_data.size > 0:
                max_val = np.max(recent_data)
                min_val = np.min(recent_data)
            else:
                max_val = np.max(centered_data)
                min_val = np.min(centered_data)

            if np.isclose(max_val, min_val):
                max_val += 1; min_val -= 1

            target_max = max_val * Y_AXIS_PADDING_FACTOR
            target_min = min_val * Y_AXIS_PADDING_FACTOR
            current_min, current_max = y_limits[i]
            smoothing_factor = 0.1
            new_max = current_max * (1 - smoothing_factor) + target_max * smoothing_factor
            new_min = current_min * (1 - smoothing_factor) + target_min * smoothing_factor
            ax.set_ylim(new_min, new_max)
            y_limits[i] = (new_min, new_max)

    except Exception as e:
        print(f"!!! ERROR IN UPDATE_PLOT: {e}")

if __name__ == "__main__":
main()Method B: Legacy Python Web Plotter (Deprecated) This method is outdated and no longer recommended. Click to expand if needed.
This method uses a Python script to stream data to a real-time plot in your web browser. It is less stable than Method A.
-
B.1: Get the Code
In your terminal, navigate to a memorable folder (like Desktop). Then, clone the repository containing the script.
git clone https://github.com/shakimiansky/Shared_Cerlog_ESP_EEG_BCI.git -
B.2: Install Libraries
First, navigate into the folder you just cloned.
cd Shared_Cerlog_ESP_EEG_BCINow, install the required Python packages. (Remember to use
pip3on Mac).pip install numpy pyserial plotly dash scikit-learn -
B.3: Run & View
Navigate into the Python displayer subfolder.
cd PythonEasyDisplayRun the script. It will automatically find the board and print a URL. Open this link in your browser to see the data. (Remember to use
python3on Mac).Wait for the Green LED!
After plugging in the board, wait a few seconds for the green GPIO17 status LED to turn solid on. This indicates the firmware has loaded and the board is ready. The script will only be able to connect after this LED is lit.
python Python_Data_Displayer.py
5. Running an EEG Session
- Hardware Assembly: Connect your EEG cap cable(s) to the required touch-proof adapter(s), then plug the adapter(s) into the electrode headers on the Cerelog board.
- Prepare the Subject: Fit the EEG cap on the subject's head. Apply a small amount of conductive gel into each electrode cavity to ensure good skin contact.
-
Connect Reference & Bias (Ear Clips):
For accurate BCI data collection, you must use two ear clip electrodes with conductive gel.
- Connect the first ear clip to the BIAS pin.
- Connect the second ear clip to the SRB1 pin (this acts as the Ground/Reference in the default montage).
- Attach one clip to each earlobe.
- Connect and Stream: Connect the board to your computer via USB-C. Launch your chosen software or script, and start the data stream.
⚠️ Safety Reminder
As per the notice in Section 1, only connect to a laptop running on its own battery power. **DO NOT** use this device if the laptop is charging or connected to a desktop computer plugged into a wall outlet.
- Check Signal Quality: Observe the incoming data. If a channel is flat or excessively noisy, check the corresponding electrode's position and consider re-applying a small amount of gel.
IMPORTANT: Signal Quality & Artifacts
The human body acts like an antenna, picking up the 50/60 Hz hum from nearby electrical mains. This noise is often much stronger than the tiny EEG signals from the brain. Getting a clean signal is critical for any BCI application.
1. Effective Filtering & "Jaw Clench" Artifacts
The Cerelog board utilizes highly effective filtering on the BIAS pin to cancel out common-mode noise. Because of this superior noise cancellation, you might not see massive, screen-filling spikes when you clench your jaw, unlike on some cheaper or older hardware. This is normal. It means the board is successfully filtering out the noise generated by the muscle movement, allowing the EEG signal to remain cleaner.
2. Use the Bias Probe Correctly
The **BIAS probe** is the single most important tool for noise cancellation. It measures the mains hum from the body and subtracts it from the EEG channels. You will get poor data without it. Ensure the ear clips used for BIAS and SRB1 have plenty of conductive gel.
3. Filter Your Data
For best results, especially with BrainFlow, we highly recommend applying a **notch filter** to your data in software to remove any remaining 50 Hz or 60 Hz noise.
6. Advanced Usage: Firmware Customization
Firmware Access is Restricted
To receive the firmware source code or if you need the code to change montages, please email support@cerelog.com with your proof of purchase (e.g., order number). Firmware can be modified and flashed using the Arduino IDE.
⚠️ WARNING: Custom Firmware & Software Compatibility
Any modifications you make to the firmware are **not guaranteed to work** with the provided BrainFlow fork, Python plotter, or games. Changes to critical parameters like sample rate, data resolution, or packet structure **will** break the software.
If you modify the firmware, you may be required to make heavy modifications to the software to maintain compatibility. This is an advanced task and is your own responsibility.
Configuring the Arduino IDE
Before flashing, you must configure the IDE with the correct settings:
- Board: Navigate to
Tools > Board > ESP32 Arduinoand select **'ESP32 WROOM DA Module'**. - Port: Navigate to
Tools > Portand select the COM port corresponding to your Cerelog board.
Modifying the firmware is necessary to:
- Change Electrode Montage: Switch from the default Referential mode to Sequential mode. Sequential mode measures the difference between P and N pins directly, requiring two adapters.
- Adjust Gain: Change the Programmable Gain Amplifier (PGA) setting (1, 2, 4, 6, 8, 12, or 24).
- Control Peripherals: Write custom code to activate the haptic feedback motor or use the debug LEDs.
- Change Sample Rate: This is a highly advanced modification. Altering the sample rate or resolution will change the data stream format and will require you to rewrite the data parsing logic in your software.
CRITICAL: Procedure After Flashing Firmware
- After a successful flash, you MUST perform a full power cycle. Unplug the USB-C cable. If a battery is connected, unplug it as well.
- Reconnect the power (USB-C and/or battery).
- Your computer may assign the board a new COM port number. Check your Device Manager to see the new port assignment.
- When you run your software again, both the Python plotter and a properly configured BrainFlow script should find the new port automatically. If you have hard-coded a specific COM port in a custom script, you will need to update it manually.
7. Troubleshooting Guide
- Problem: Board not detected (no COM port appears).
-
- First, try a different USB port and ensure you are using a USB-C data cable, not a charge-only one.
- If it's still not detected, proceed with the optional CH340C driver installation in Section 4.
- Check for the green power LED on the board. If it's not on, there is a power issue. - Problem: My script fails to connect.
-
- Make sure the green status LED is on before running your script. This indicates the firmware is loaded and ready.
- Try a full power cycle. Disconnect the USB-C cable, wait a few seconds, and plug it back in before re-running your script.
- Make sure no other program is already connected to the board's COM port. Only one application can use the port at a time.
- If you recently flashed new firmware, see the "Procedure After Flashing" notes in Section 6. - Problem: Data is extremely noisy or flat.
-
- Poor electrode connections are the most common cause of bad signal quality. Ensure that all electrodes, especially the **BIAS probe**, have a secure, low-impedance connection.
- Ensure you are not near sources of high electromagnetic interference (e.g., power bricks, fluorescent lights, powerful fans).
- Re-apply conductive gel to the problematic electrodes.
8. Product Demonstrations
See the Cerelog ESP-EEG board in action. These demos showcase the real-time data streaming and BCI control capabilities.
Product Demos
See the Cerelog ESP-EEG board in action. These demos showcase the real-time data streaming and BCI control capabilities.
Product Overview Guide and Live Data Visualization
Video demonstrating how to use product for real-time EEG signal data streaming and plotting.
9. Applications & Possibilities
This board is a versatile tool for developers and researchers. With custom software, you can explore a wide range of applications.
- Multimodal Signal Acquisition: Capture data for EEG (brain), EMG (muscle), ECG (heart), and EOG (eye movement).
- Neuroscience Paradigms: Design experiments based on P300, Event-Related Potentials (ERP), and Steady-State Visually Evoked Potentials (SSVEP).
- BCI & Control Systems: Develop systems to quantify cognitive or emotional states, or to control robotics and other external devices.
10. Appendix: Technical Details
Technical Specifications
Understanding Electrode Montages
The board can be configured in two primary ways:
- Referential Montage (Default): Each channel measures the potential difference between a positive input (Pins 1-8+) and a common reference. In this mode, the SRB1 pin is configured as the common ground/reference for all channels. This configuration is standard for most BCI applications and typically requires only a single 10-pin adapter.
- Sequential / Bipolar Montage (Requires Firmware Mod): Each channel measures the potential difference between a positive input (INxP) and a negative input (INxN). For example, Channel 1 is (IN1P - IN1N). This requires two 10-pin adapters to connect all necessary pins.
A Note on Performance
The core of this board is the research-grade TI ADS1299 ADC. While the chip has exceptional theoretical performance (capable of resolving ~10µV signals), real-world board performance will be influenced by your setup, environmental noise, and electrode contact quality. For complete details on the ADC, see the official TI ADS1299 Datasheet.